How Can We Help?
Feature Analysis and Download
How do I understand how each feature contributed to my pipeline?
When a Machine Learning Pipeline powers high-value initiatives for your business, it’s important to understand the internal logic driving its predictions. In this guide, we’ll show you how to analyze which features contribute most to your pipeline’s decisions.
Cortex provides three tools to help analyze features: Feature Importance, Feature Impact, and Feature Downloads. All three of these can be found in the Pipeline Discoveries area of a Cortex pipeline.
To frame these analyses in real terms, consider a Future Events pipeline which predicts each user’s probability of purchasing within the next 14 days. Note however that your Cortex account can be configured to make predictions about any type of object tied to your event data (e.g. commerce items, media content, home listings, etc.).

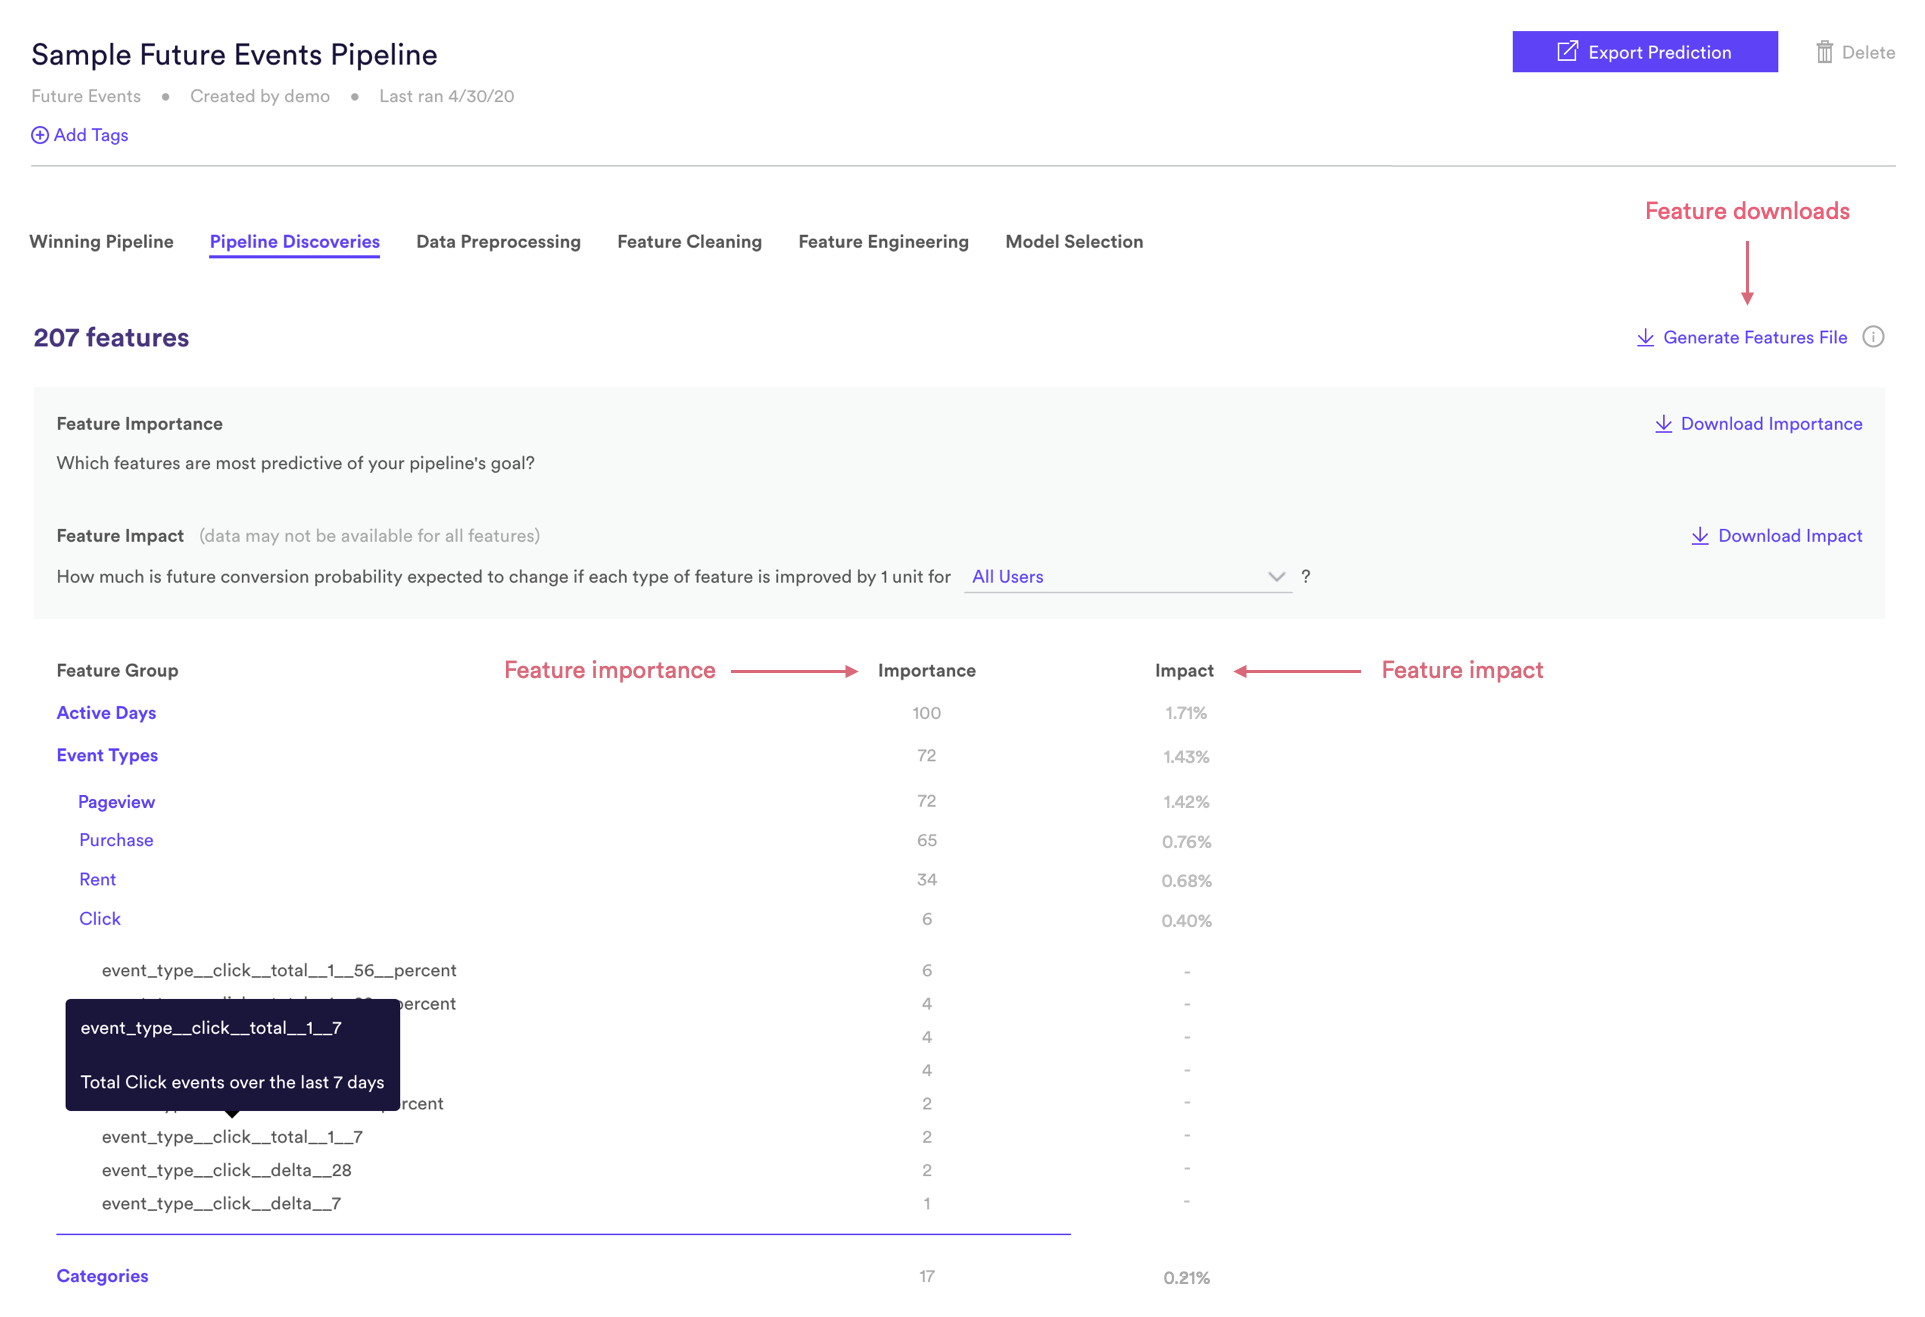
The features generated by your pipeline are grouped based on the type raw data that each is calculated on. For example, the above screenshot shows three feature groups features for our sample pipeline:
- Active Days: features computed based on each user’s day-by-day pattern of activity
- Event Types: features computed based on the types of events recorded for each user
- Categories: features computed on the item categories that each user has interacted with
The feature group Event Types is expanded to show its subgroups, which represent each available type of event. Finally, the Click subgroup is expanded to show the individual click-related features. Hovering over a feature pops open a description of what that feature represents.
Feature Importance
Feature importance allows you to understand which features are most predictive of your pipeline’s goal. Feature importance ranges from 0-100, where higher scores are assigned to more predictive features. In terms of our example pipeline above, we can see that features related to each user’s Active Days are most important for predicting their probability of purchasing in the future.
Feature importance is calculated based on mutual information, which carries a simple intuition: if all I know about each user is feature X, with what degree of certainty do I know goal Y (e.g. whether each user ended up purchasing within 14 days)? In this way, feature importance is similar to correlation, but also accounts for nonlinear relationships between a feature and your goal.
Feature importance is calculated for each individual feature. The figures reported on the feature group and subgroup levels represent the maximum importance of individual features within.
Feature Impact (Future Events)
Feature impact is a proprietary metric created by Cortex specifically for Future Events pipelines. Feature impact estimates how conversion probability (defined by your pipeline’s goal) is expected to change if you were to improve each feature type by one unit.
For example, in the screenshot above a 1.4% feature impact for the Click subgroup indicates that getting an extra click event from each user would boost the probability that they go on to purchase within 14 days by 1.4%, on average. You can also view the result of this calculation specifically for high-propensity users (top 33% by predicted conversion rate), medium-propensity users (middle 33%), or low-propensity users (bottom 33%).
Feature importance is calculated for each subgroup. The figures reported on the feature group level represent the maximum impact of the subgroups within. Note that feature impact may not be available for every subgroup if results are not statistically significant.
You may see features with relatively high importance and low impact, or vice versa. This is because a one-unit change (the basis of feature impact calculations) is more meaningful for some features than others. Take for example a feature group which describes how many pageview events each user records. This feature may be very important for predicting each user’s purchase probability, but since this event type occurs frequently, generating one extra pageview on average might have a low impact on future behavior.
Feature Analysis
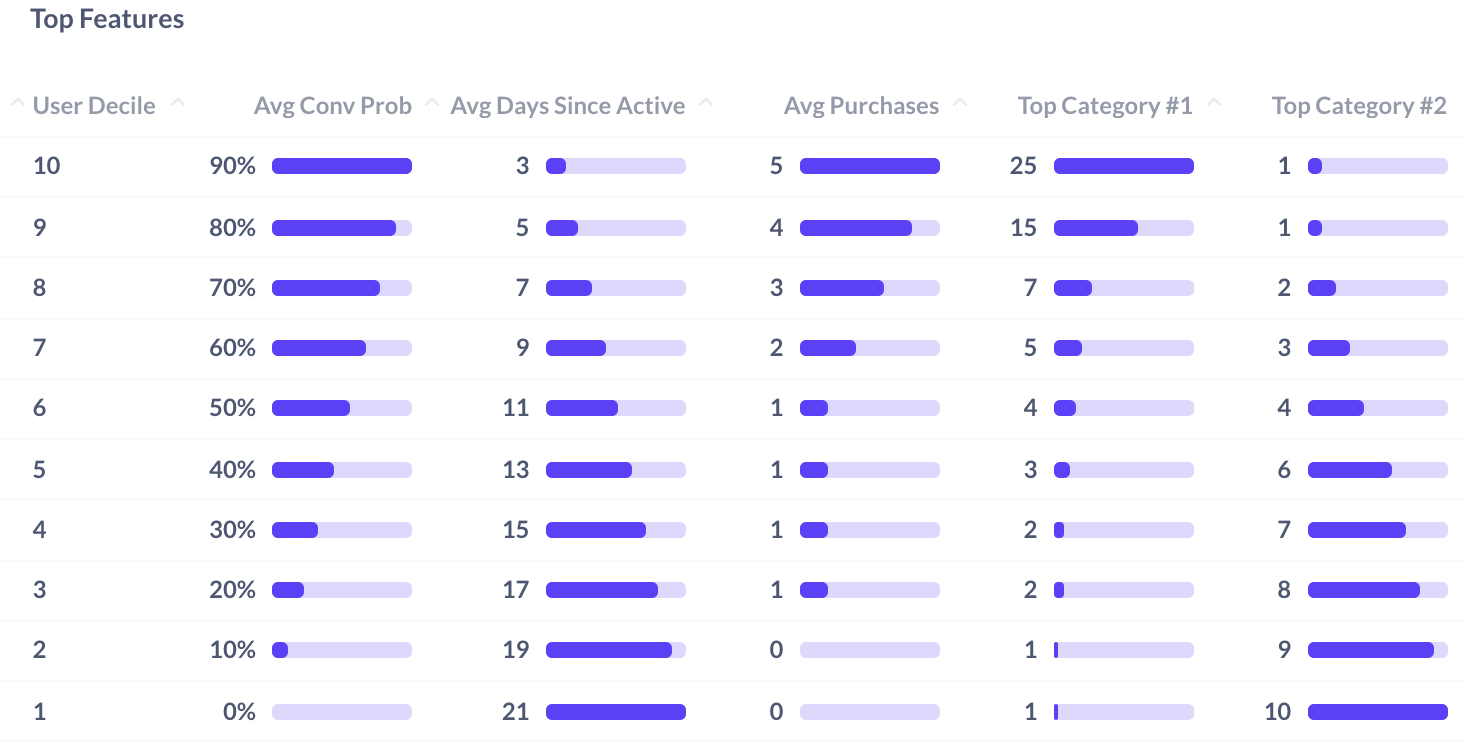
In addition to Feature Importance and Impact, Features can be evaluated through Cortex Insights. This analysis would be created in conjunction with your Cortex Support team, and it can help visualize the correlation between Average Feature Values and the Likelihood of different user groups to convert.

The above feature analysis visualization is looking at the correlation between those users most likely to convert and the average feature values of those users groups. In the example visualization: those users with the highest likelihood to convert come more often and purchase more often than those users least likely to convert. And additionally, those users most likely to convert more often engage with Category #1 and less likely to engage with Category #2.
Feature Downloads
If you’d like to conduct custom feature analyses beyond those provided off-the-shelf, Cortex also allows you to download all feature data along with the predictions generated by any pipeline. Accessing this data lets you answer questions like –
- What do high propensity users (e.g. users with a high predicted probability of purchasing within 14 days) have in common?
- Why was this particular user assigned a low prediction?
- How do these particular features relate to one another?
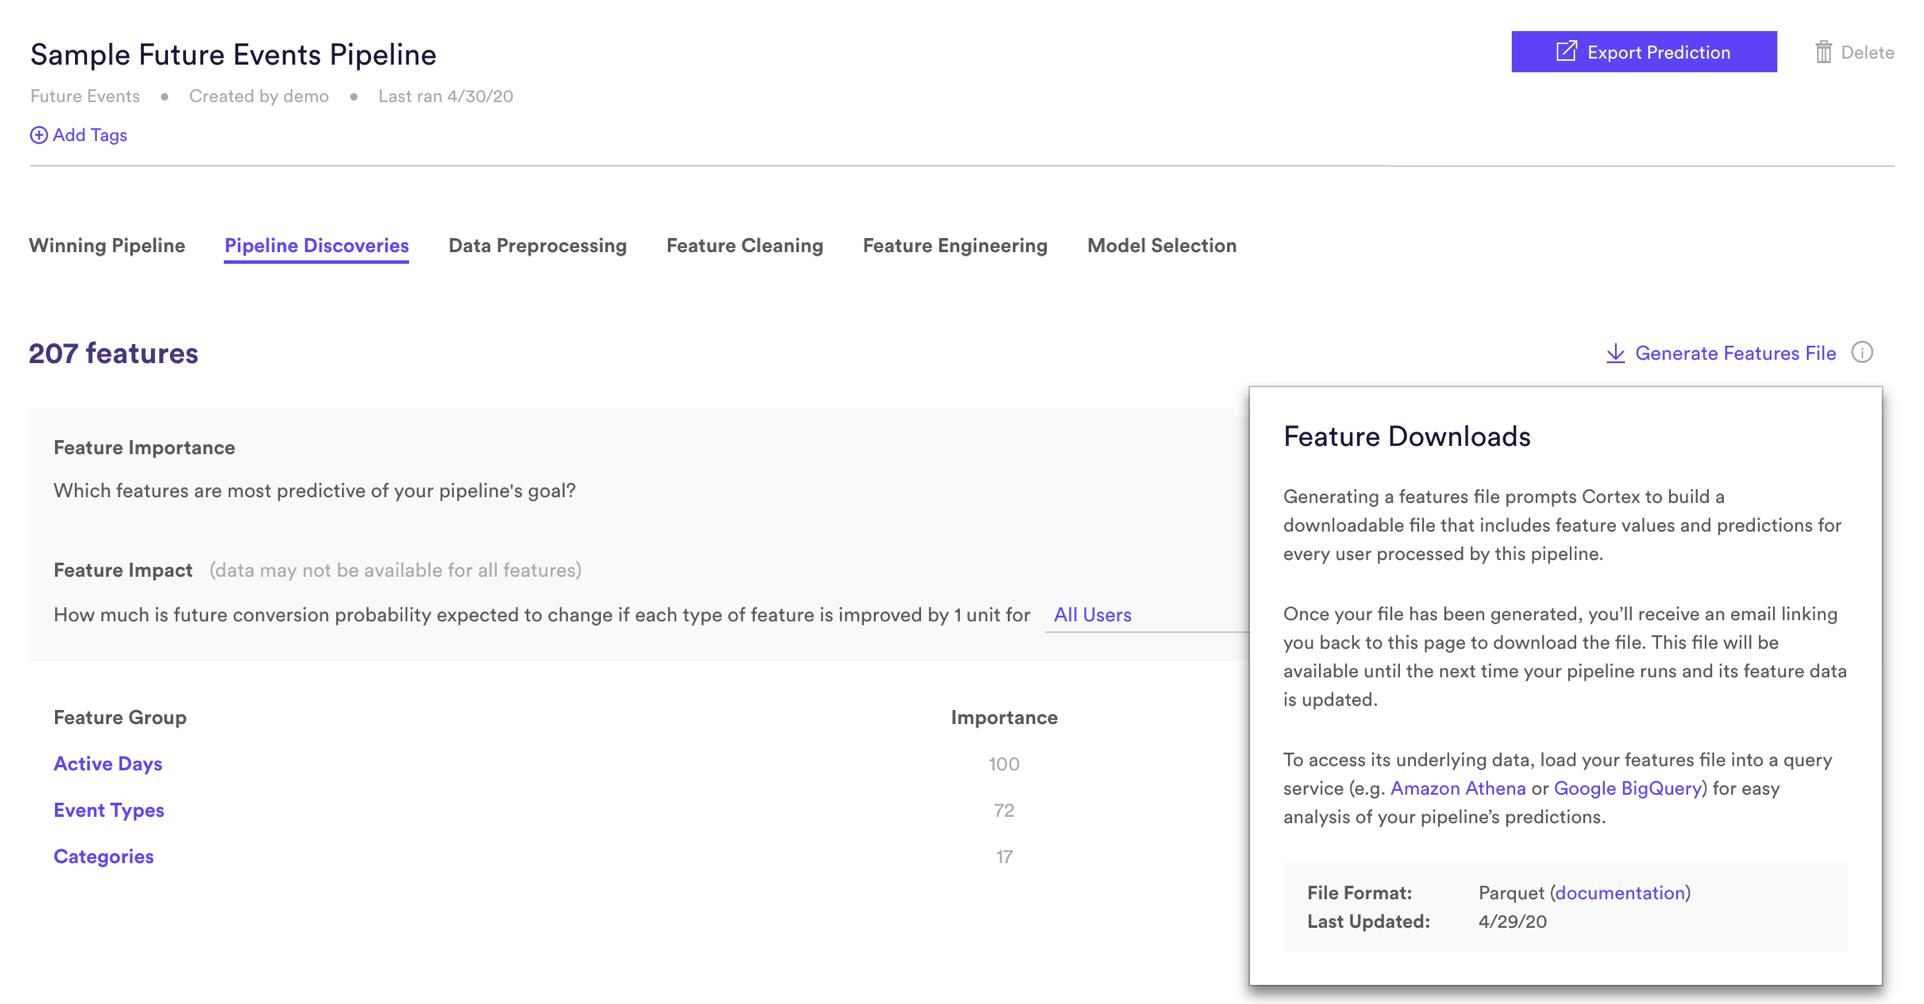
To access feature data from your pipeline’s latest run, hit the “Generate Features File” link within Pipeline Discoveries. You’ll receive an email linking you back to Cortex when the data is ready to be downloaded. Your pipeline’s feature data — which often consists of millions of rows and hundreds of columns — will be downloaded in parquet format, where it can be loaded into services such as Amazon Athena or Google BigQuery for query-based analysis.

Related Links
Still have questions? Reach out to support@mparticle.com for more info!