How Can We Help?
Adding Custom Features to a Pipeline
Custom Feature Engineering allows you to transfer your business knowledge directly into Cortex using a simple UI. In just a few clicks, you can define a custom feature, add it to any Machine Learning Pipeline, and quickly gauge its predictive value. This lets you tailor your ML pipelines specifically to your business’s data and use cases.
Augment the Machine Learning Pipeline
Feature engineering is arguably the most critical component of the ML Pipeline. It’s also the most domain-specific – building predictive features can require knowledge of your underlying business problem.
Cortex will automatically identify and build predictive features for each ML Pipeline without any human intervention necessary. Typically Cortex will automatically generate upwards of 300 unique features for each pipeline. Custom Feature Engineering allows you to augment those automated features with custom features based on intuitions of their business and ML problem.
How Do Custom Features Work?
Creating a custom feature in Cortex is optional – Cortex will always automatically search for predictive features for your pipeline. But if you’d like to inject your intuition into this process, Custom Feature Engineering gives anyone the ability to:
- Create a custom feature by writing simple SQL statements on data ingested across multiple sources.
- Manage all custom features in a simple list.
- Easily add custom features to a new pipeline with one click.
- Quickly gauge the effectiveness of custom features through Understandable ML. Also, edit your features to iterate and find the best ones for each problem.
Where do I create Custom Features?
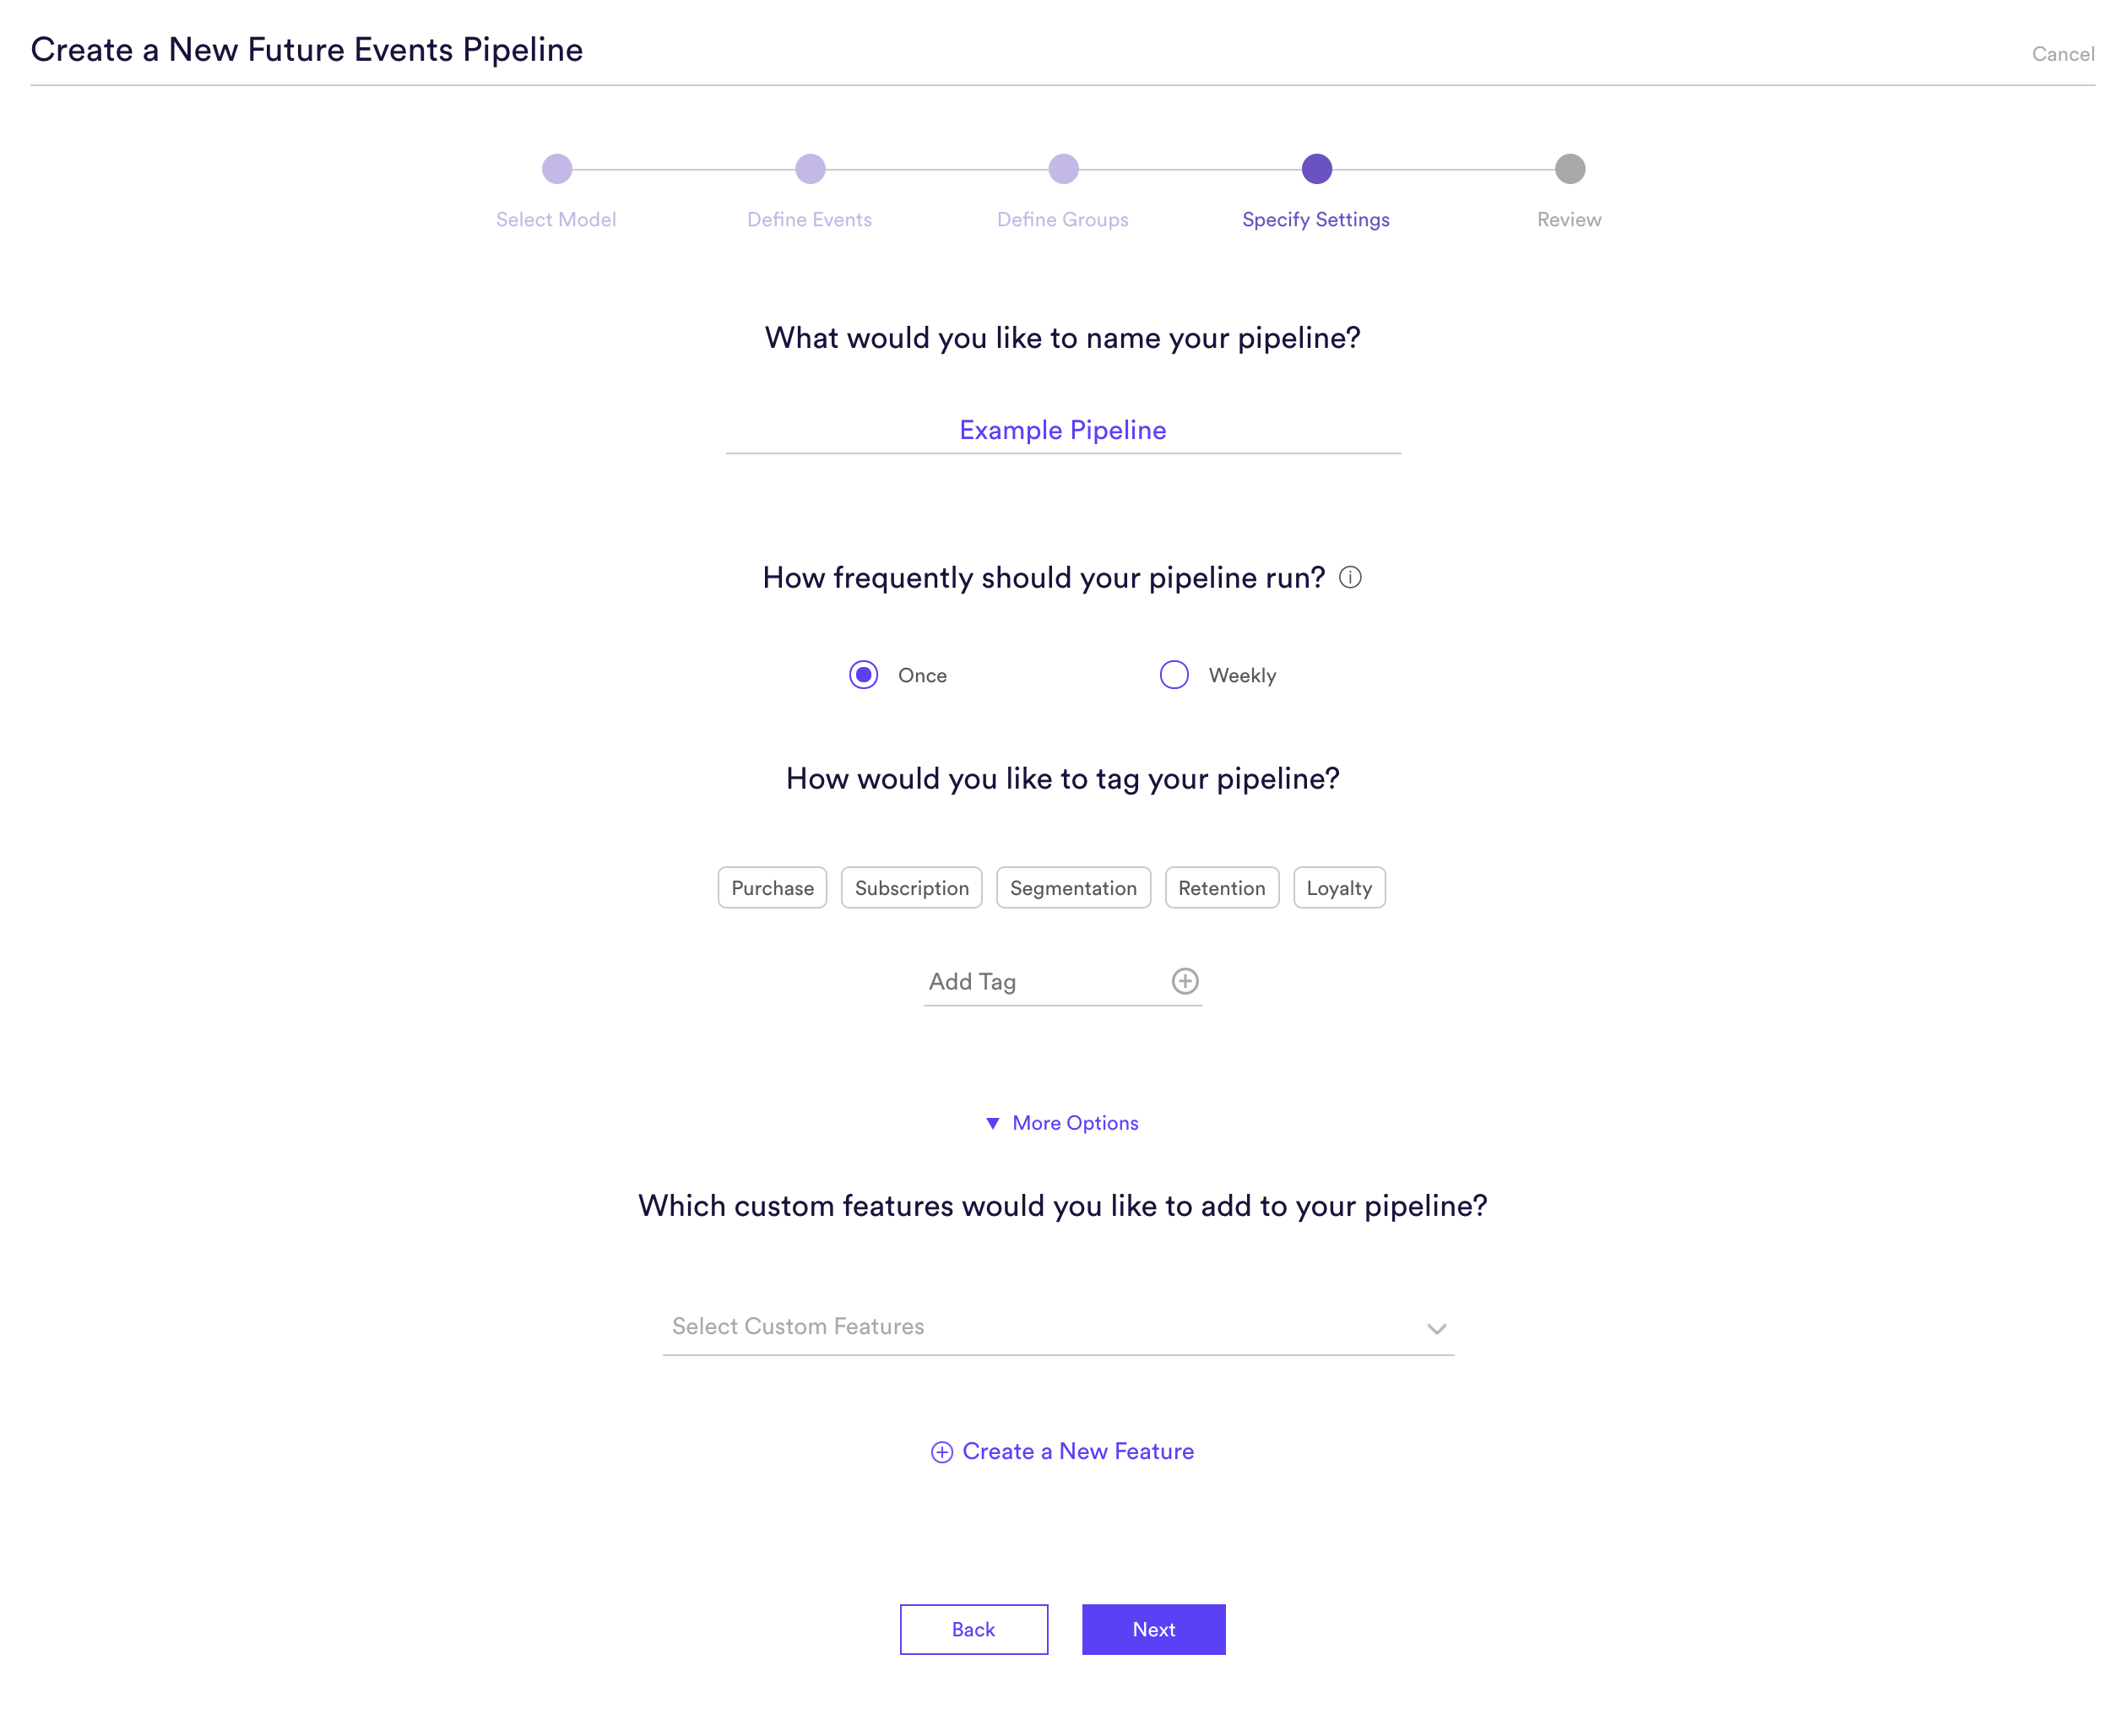
Custom features can be created for any type of pipeline in Cortex. To create a custom feature, click “More Options” within the “Specify Settings” step of the pipeline creation process.
How do I create a Custom Feature?
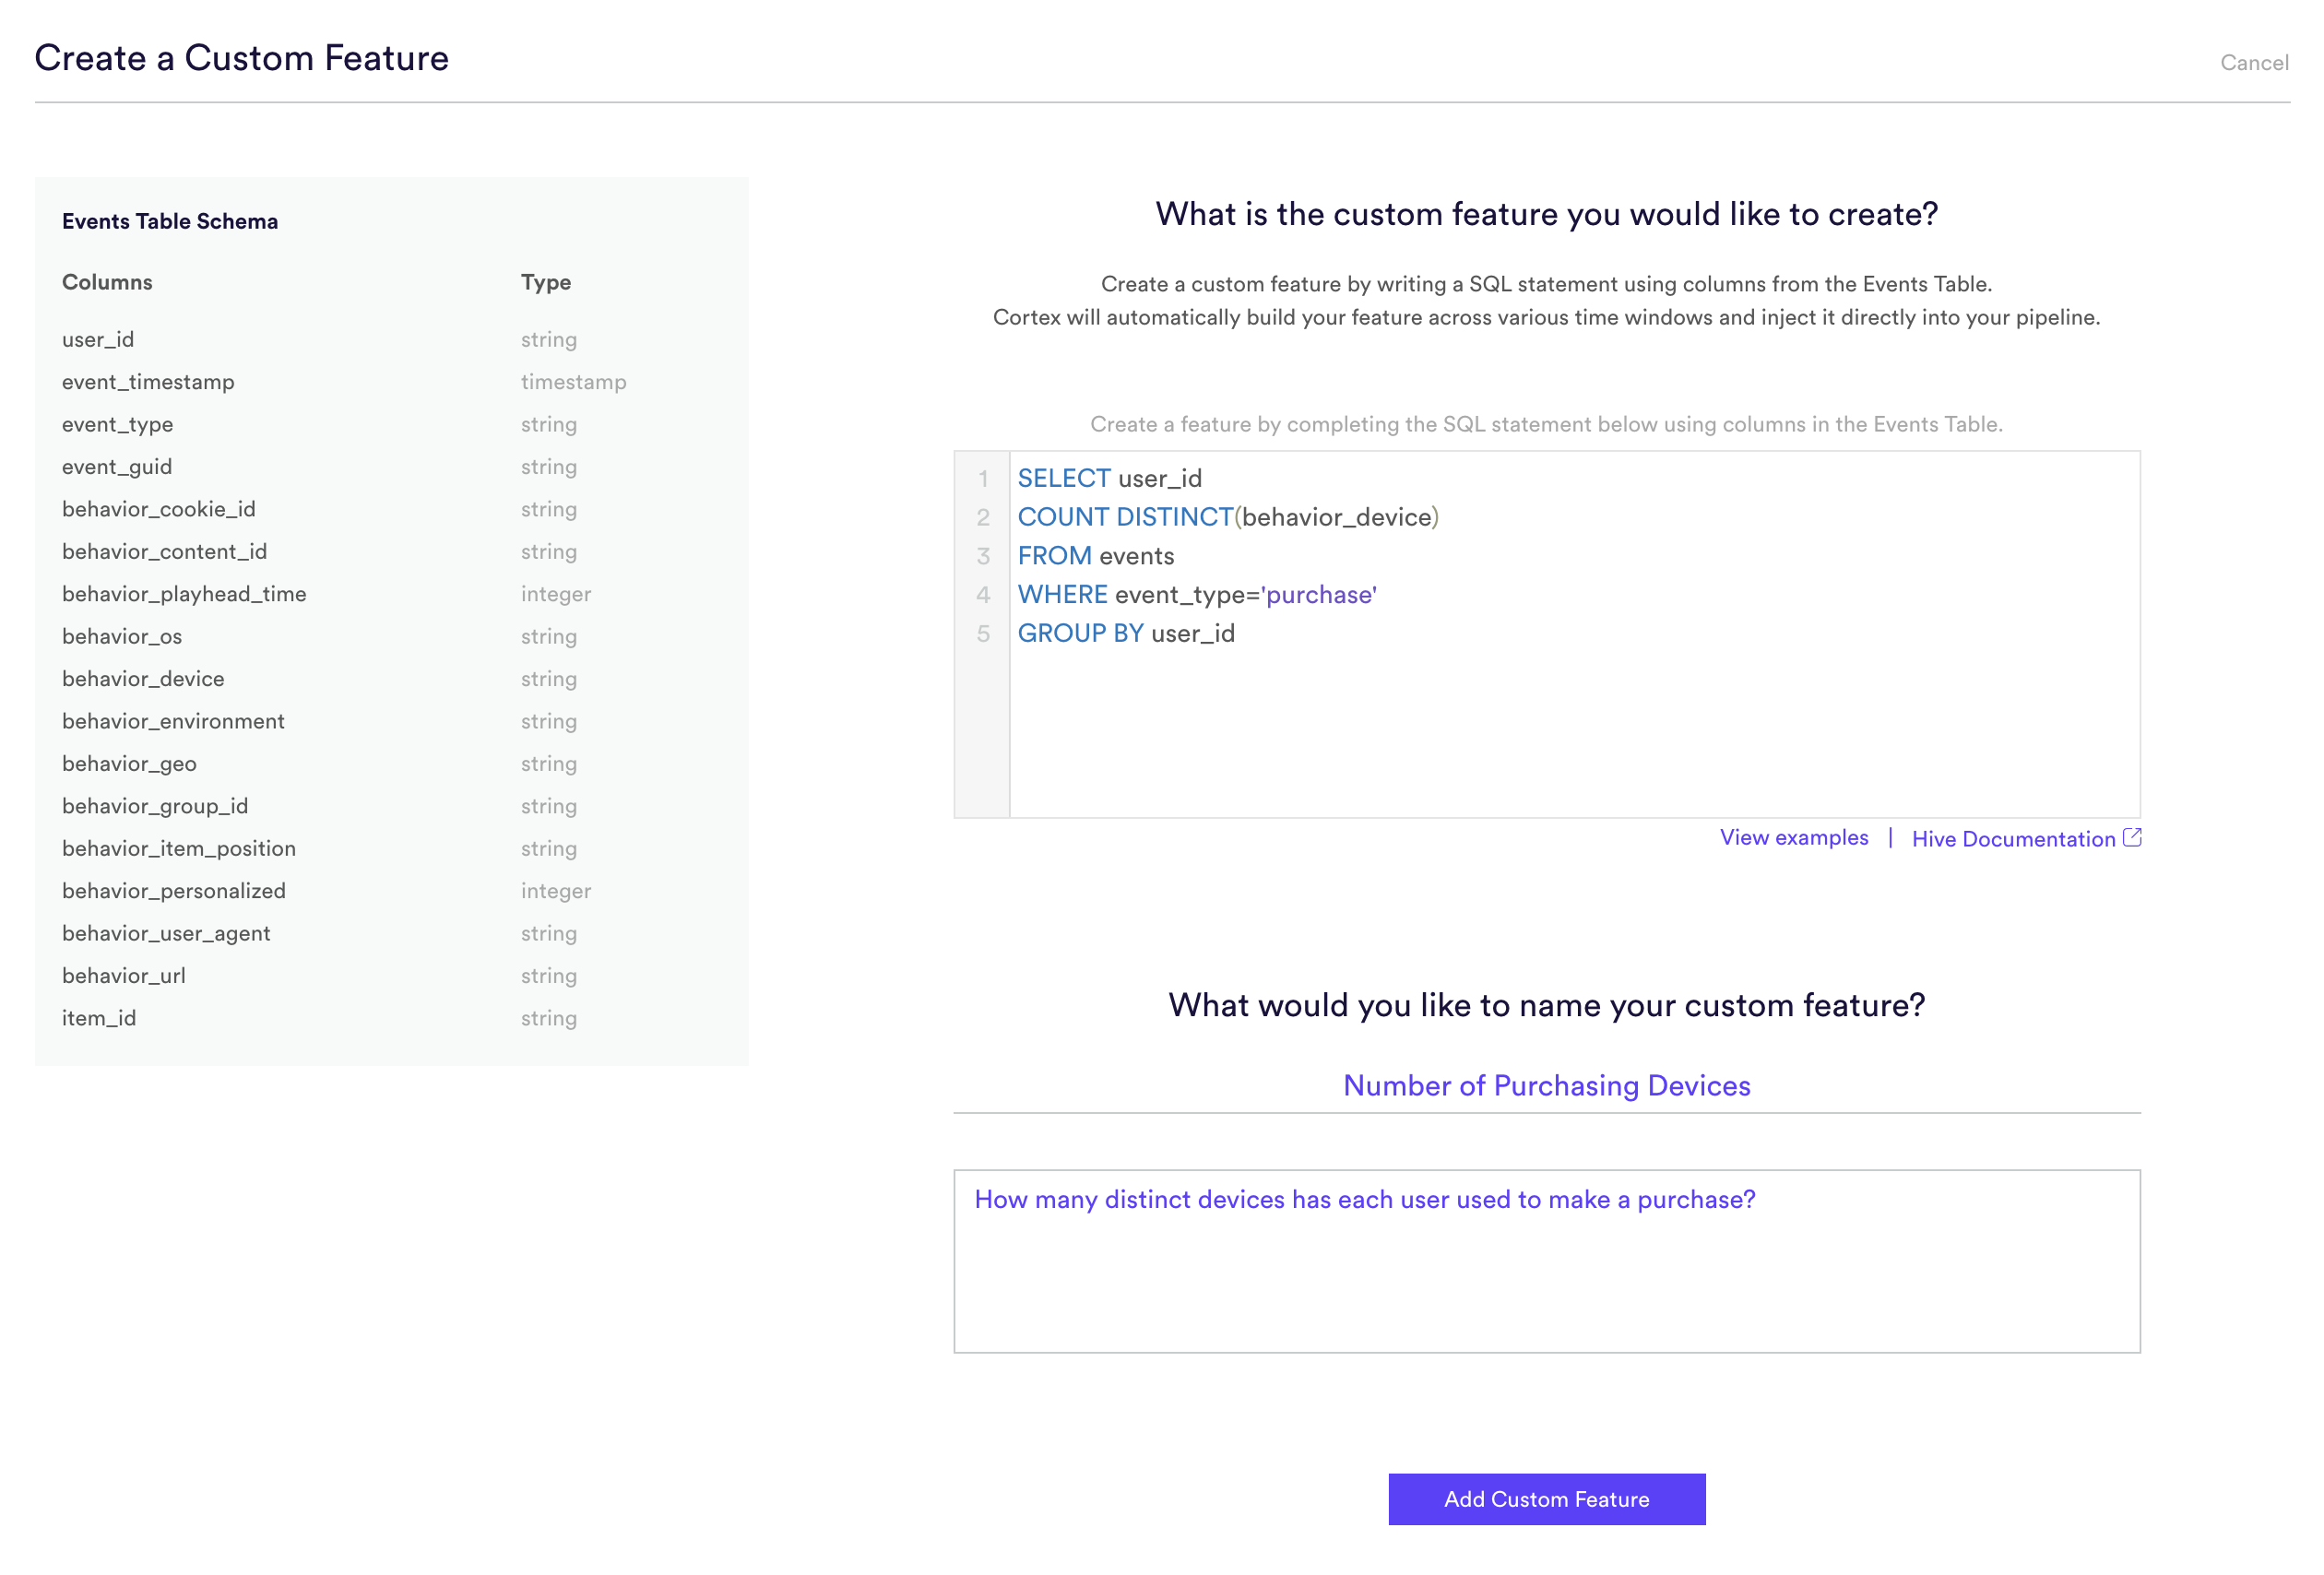
Custom Features are created by writing a SQL statement into the event data that is being stored in Cortex. Within Pipeline settings, expand More Options and select Create a New Feature. You will see the representation of the Events Table Schema, allowing you to know what columns are available to query.
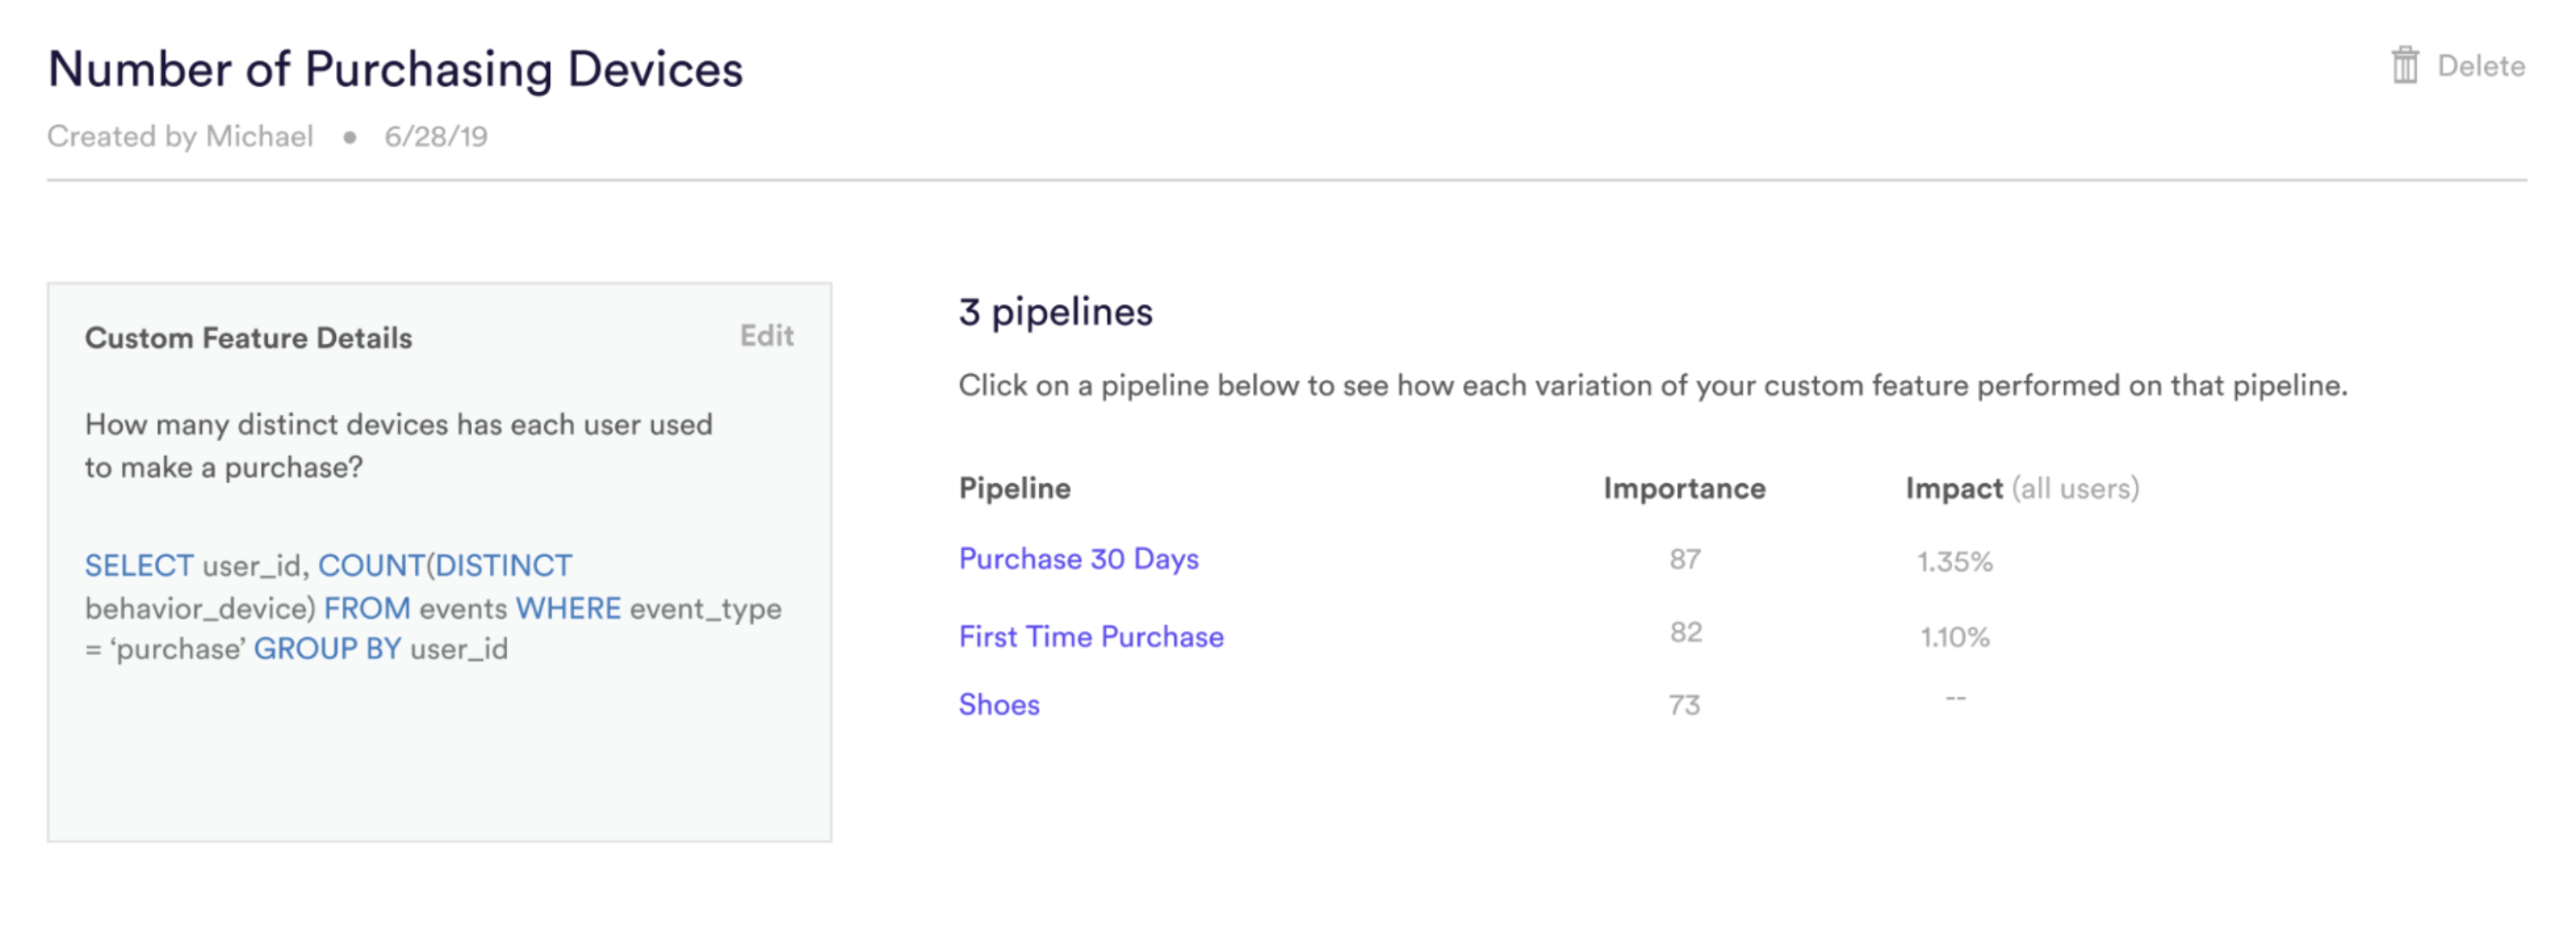
Once you have added a Custom Feature, you’ll have the ability to see, and edit, the details of that feature as well as all pipelines in which it is in use.
Where can I see the features I’ve previously created?
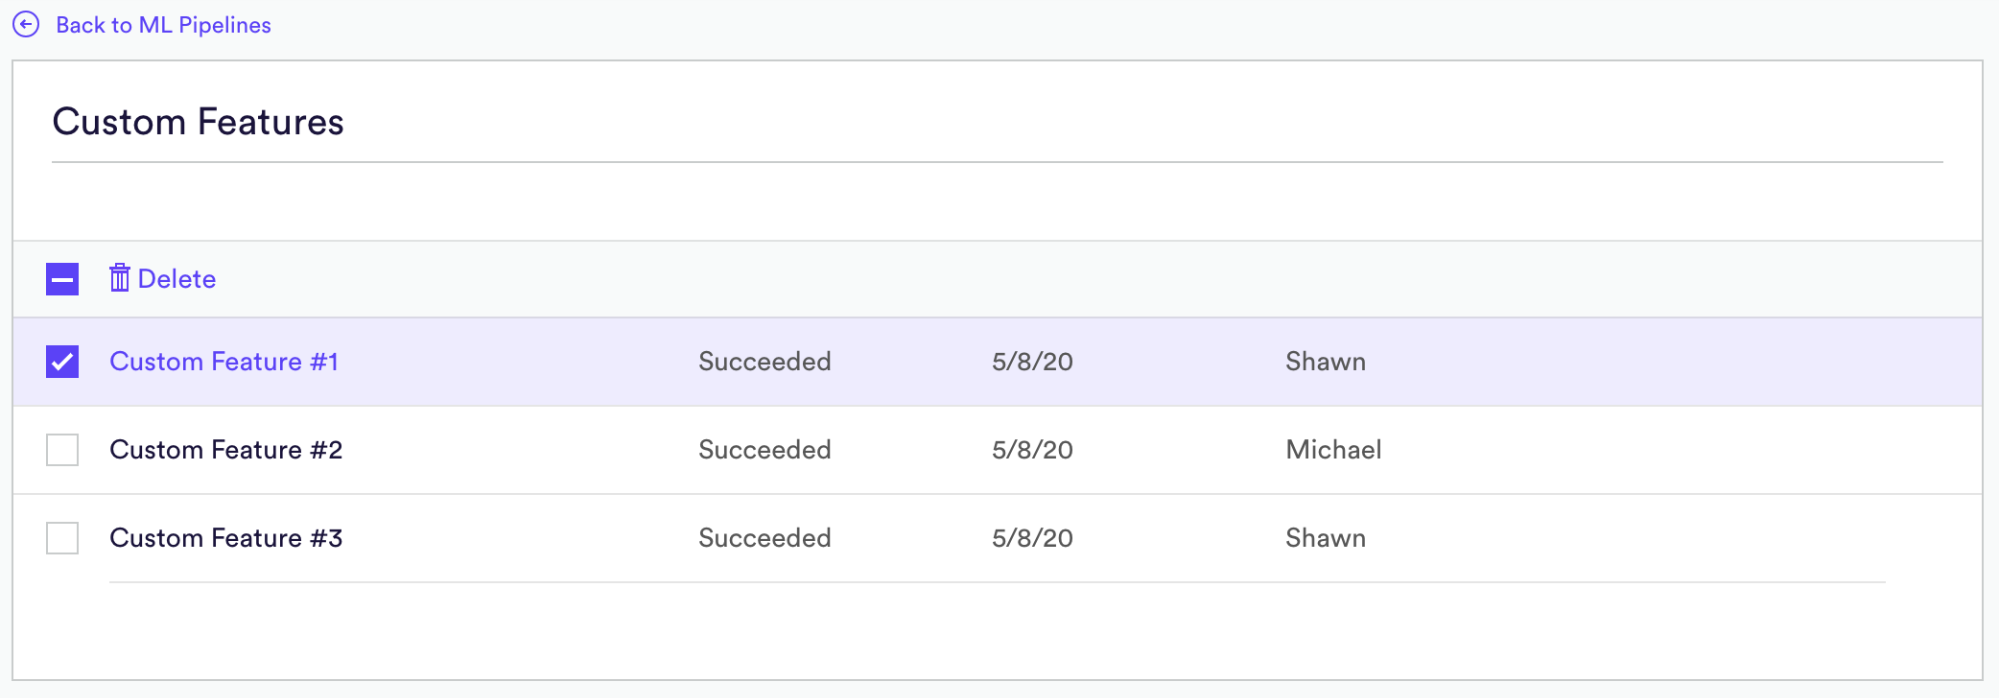
After you’ve created a custom feature, you can view all current custom features from within the ML Pipelines tab. Simply select the Gear Icon from the left navigation.

From the Custom Features table, you will have the ability to sort all existing Custom Features. Select a specific feature will show you all Pipelines in which that feature is used, and allow you to edit the details of that feature. You can also delete any Custom Features from this view.
What sort of features can I build?
You know your business best. With Custom Feature Engineering, you have the tools to create any feature that your intuition says may be predictive of the problem you’re looking to solve.
You build a custom feature by transforming your data through SQL statements like the examples below. Your SQL must select user_id and a single feature from the events table, and must group by user_id so that one distinct value is calculated for each user. Don’t worry about specifying windows – Cortex will automatically apply your new feature across various time ranges to find the most predictive ones.
For example, say you know from experience that users who are highly active on your site in the mornings are more likely to come back day after day. When you create a retention pipeline, you might apply a custom feature which measures the percent of each user’s total activity that occurs in the morning.
SELECT user_id, (SUM(CASE WHEN HOUR(event_timestamp) >= 6 AND HOUR(event_timestamp) <= 12 THEN 1.0 ELSE 0.0 END) / COUNT(event_timestamp)) FROM events GROUP BY user_id
Example Custom Feature
Commerce – Predicting Purchase Propensity
A common use case for commerce companies is predicting whether a user is likely to buy an item in the next few days. Data typically includes
- Event data associated with in-store purchasing behavior associated with user including what the user is buying and how much they are spending
- Event data associated with online behavior including shopping cart interactions, category interactions, and online purchases
- Metadata associated with users including demographic information on users
Automatically generated features typically include the most important features for generating strong performance on purchase propensity problems (here are some common automatically generated features Cortex creates for these types of pipelines). In addition, more complex features include
- The percentage of morning purchases increasing over the last 30 days (might be indicative of a change in a customer’s employment status)
- Is the customer increasingly purchasing items in a particular category over the last 90 days?
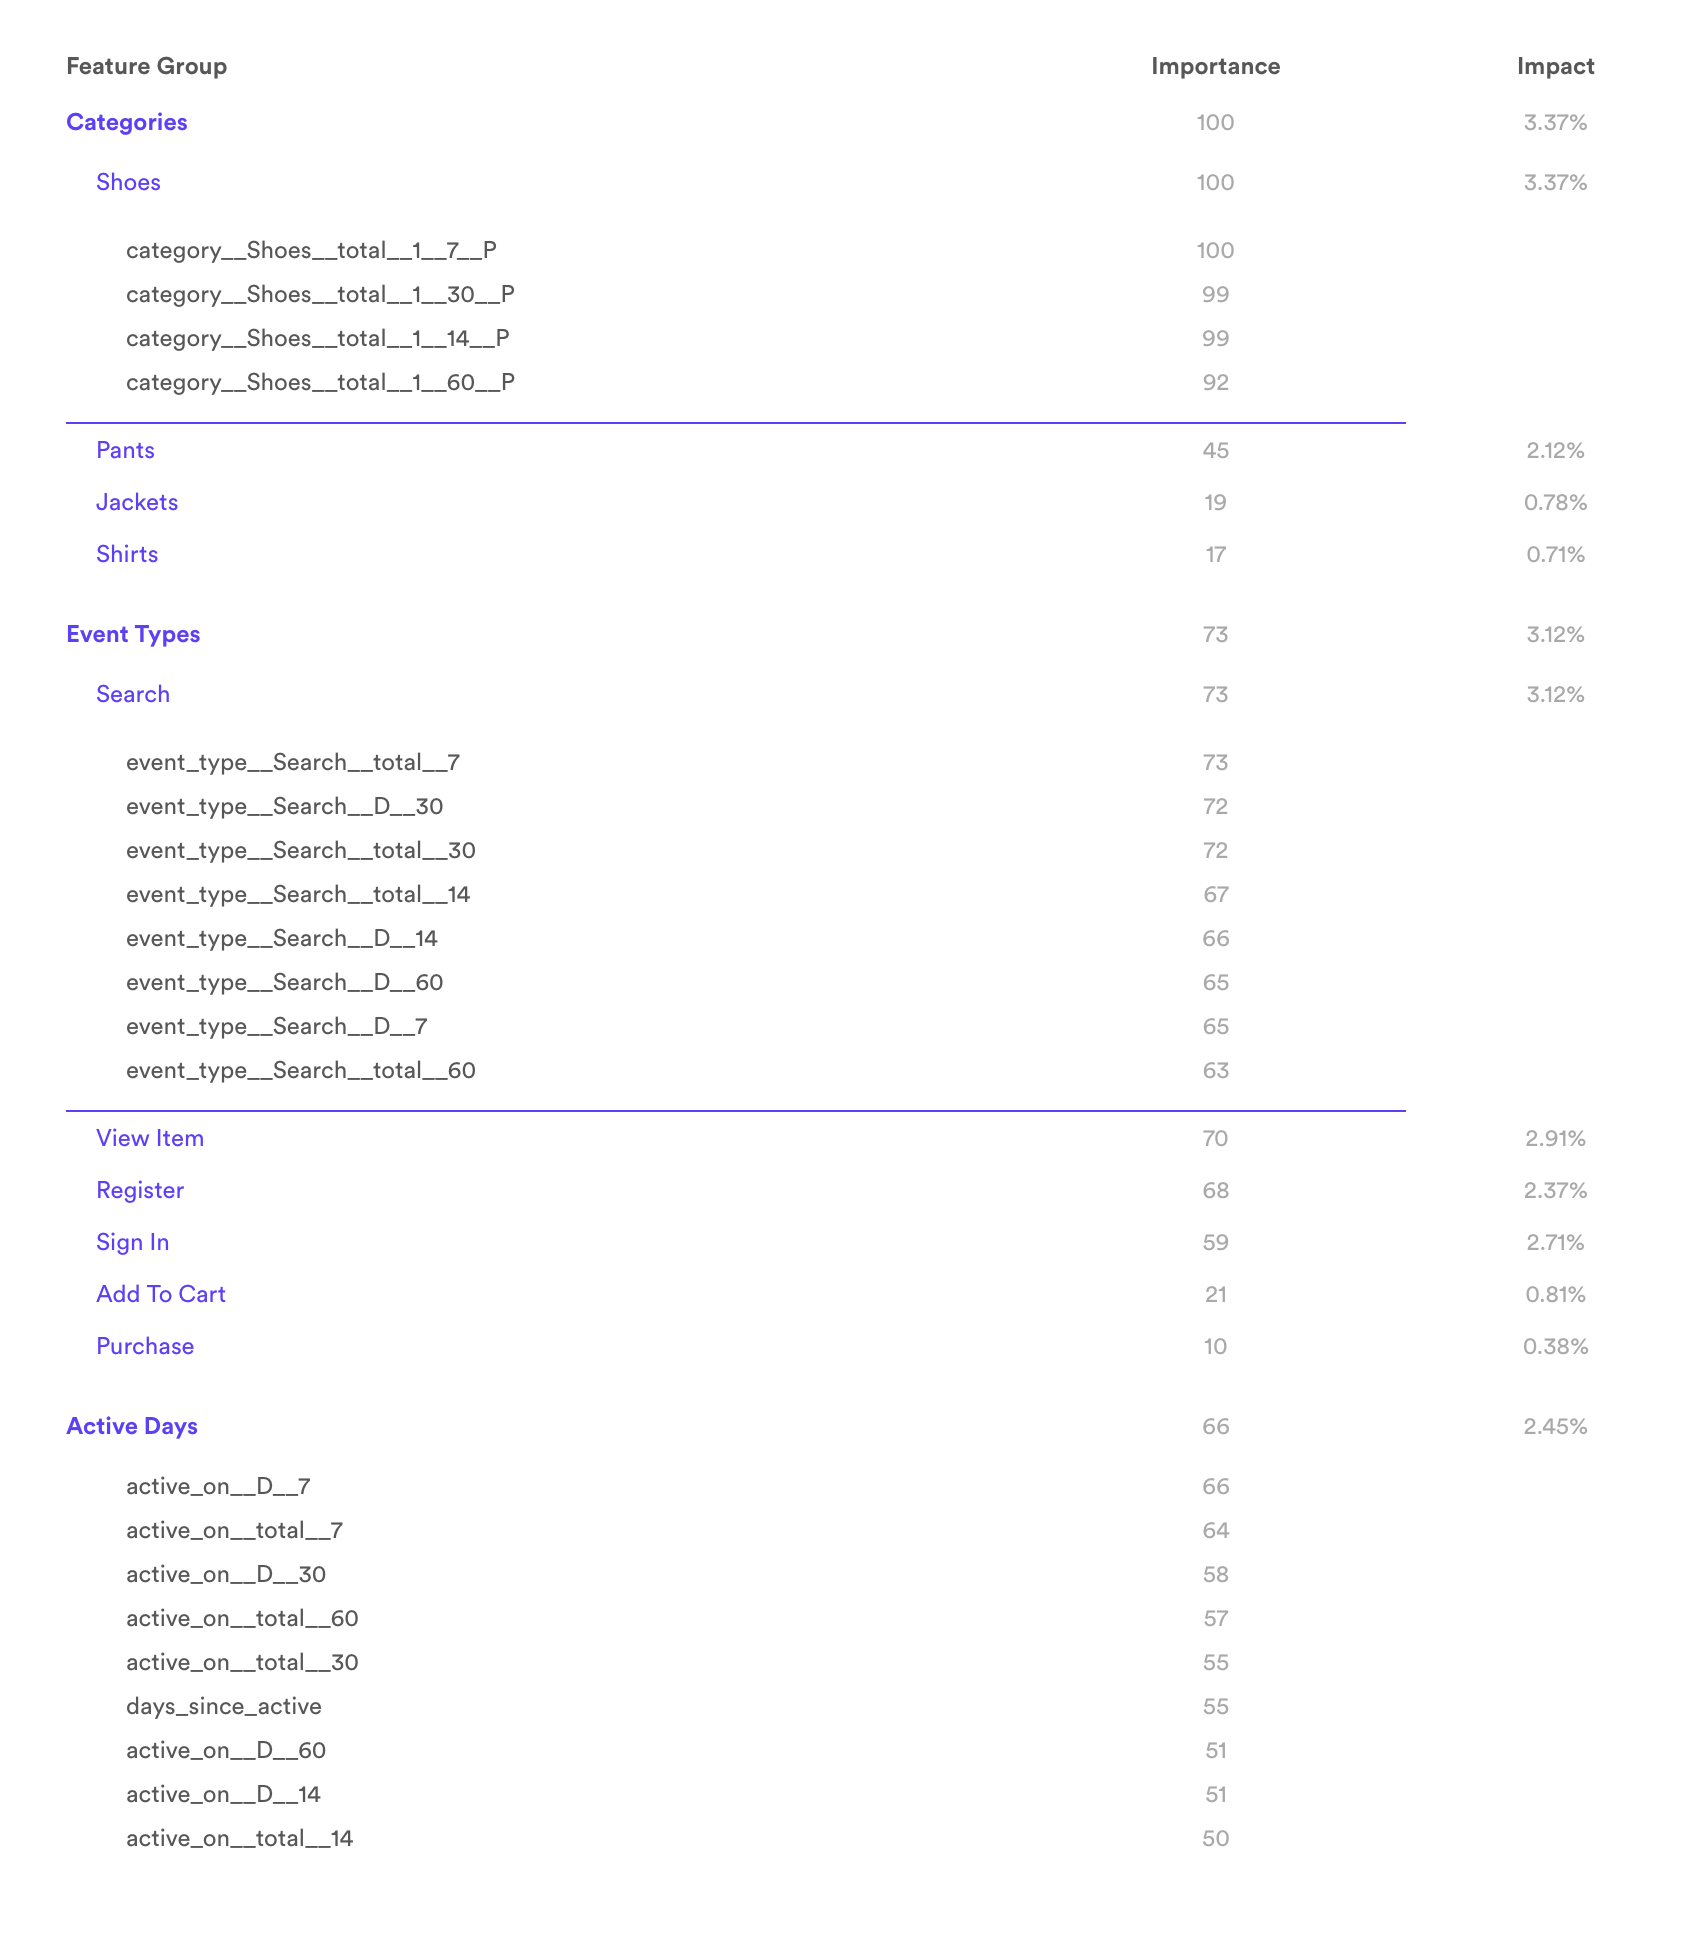
Example of automatically generated features for a typical purchase propensity pipeline. Note that the features associated with changes in category interactions and purchases tend to be represented heavily.
Average Item Price
SELECT user_id, AVG(behavior_price) FROM events WHERE event_type = 'purchase' GROUP BY user_id
Maximum Season Watched
SELECT user_id, MAX(season) FROM events WHERE event_type = 'play' GROUP BY user_id
Average Order Total
SELECT user_id, AVG(order_total) FROM (SELECT user_id, SUM(behavior_price) AS order_total FROM events WHERE event_type = 'purchase' GROUP

BY(user_id, behavior_purchase_order_id)) GROUP BY user_id
Percent of Activity in Morning
SELECT user_id, (SUM(CASE WHEN HOUR(event_timestamp) >= 6 AND HOUR(event_timestamp) <= 12 THEN 1.0 ELSE 0.0 END)

/ COUNT(event_timestamp)) FROM events GROUP BY user_id
Ratio of Purchase Events to Add-to-Cart Events
SELECT user_id, CASE WHEN add_to_cart = 0 THEN 0 ELSE (purchase/add_to_cart) END FROM (SELECT user_id, SUM(CASE WHEN event_type =

'purchase' THEN 1.0 ELSE 0.0 END) AS purchase, SUM(CASE WHEN event_type =

'add_to_cart' THEN 1.0 ELSE 0.0 END) AS add_to_cart FROM events GROUP BY user_id) GROUP BY user_id
Related Links
- How to Build a Future Events Pipeline
- How to Build a Look Alike Pipeline
- How to Build a Classification Pipeline
- How to Build a Regression Pipeline
Still have questions? Reach out to support@vidora.com for more info!